
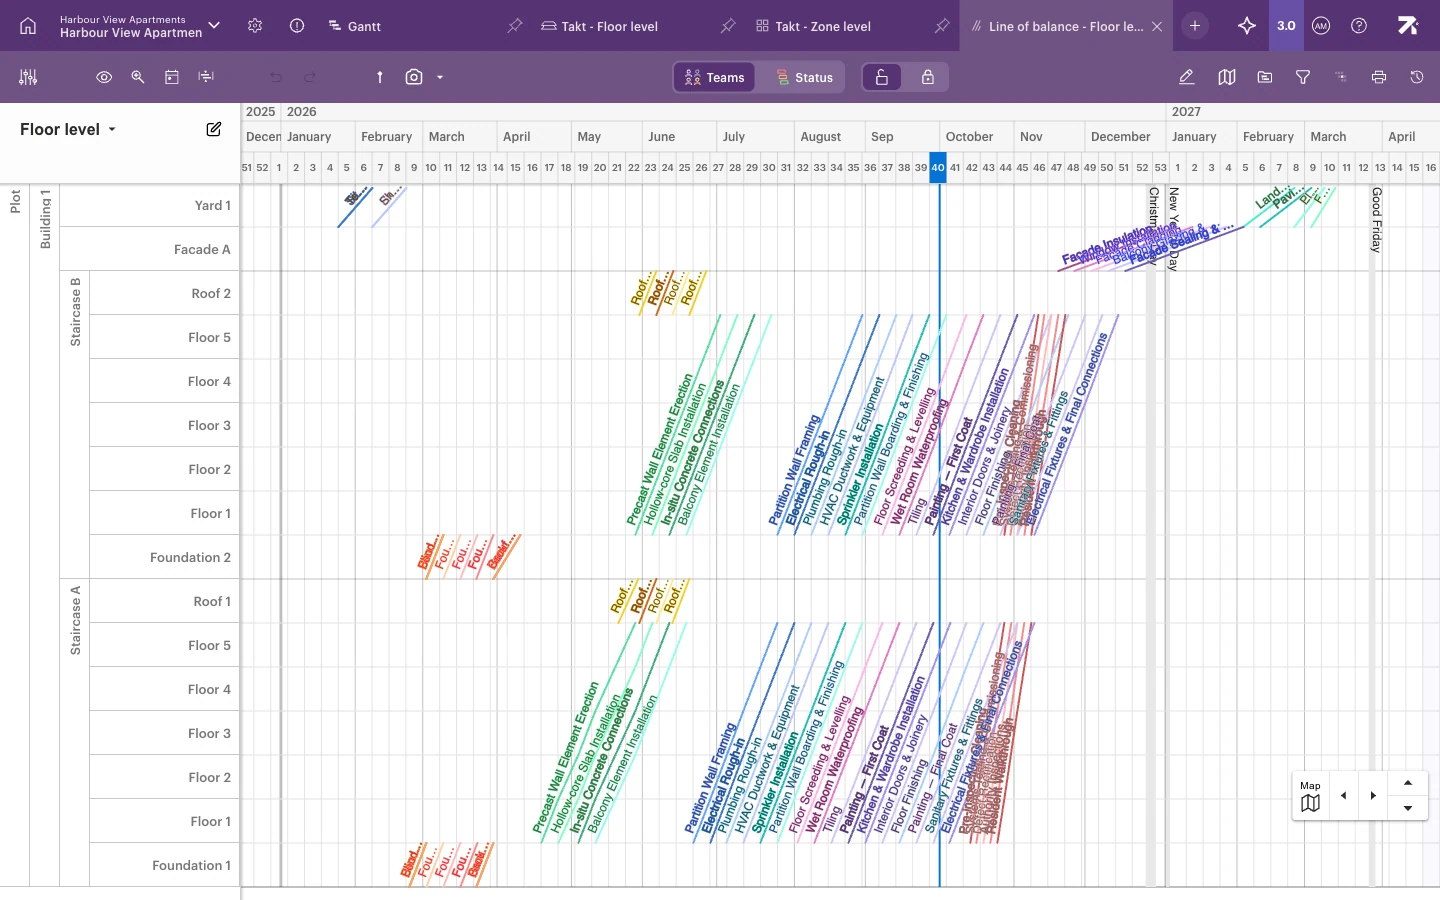
The Line of balance view draws each work package as a sloped line through the areas of your building over time. Areas run up the side, time runs across. A steep line means a trade moves quickly from area to area; a flat line means it moves slowly. Where lines get close or cross, one team is catching up with another and a clash is likely.
Before you start
- The view needs a space model. See Building the space model.
- Everyone who can open the schedule can read the view. Drawing lines needs Refine (ltd) or higher; Refine and Refine (ltd) users edit only work packages they own. Creating a Line of balance view needs Schedule, Site or Account admin.
Create a Line of balance view
- Click + (View selection and management).
- Click New view → Line of balance.
- Pick Section level, Floor level or All location breakdowns….
The rows come from the view’s location breakdown, the same way as in Takt. To switch the breakdown, click the level name at the top of the label column.
Read the lines
- Each line is one work package. It starts in the first area at the work package’s start and ends in the last area at its end.
- Work in consecutive areas joins into one continuous line.
- The blue vertical line is today. Holidays appear as vertical bands.
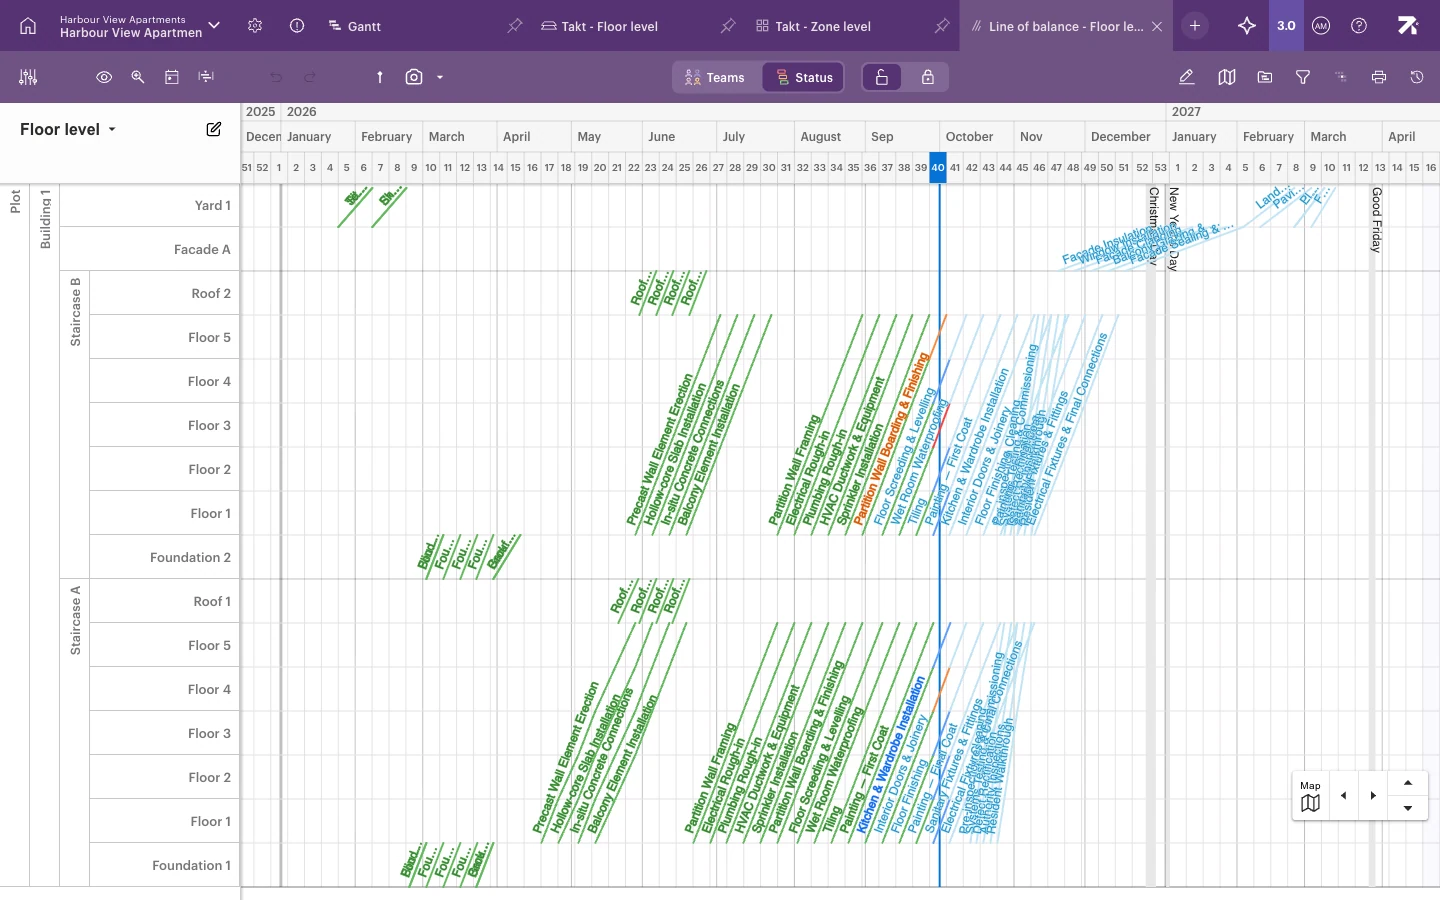
- Switch colouring with Teams | Status in the toolbar. In Status mode, lines show progress: green is completed, blue is in progress, orange is late, light blue is upcoming. Sum work packages keep their team colour.
Show a line per area
A line that runs through several areas can be split so you see each area’s work package separately.
- Right-click the line.
- Choose Show as detailed work packages.
To join the pieces again, right-click one and choose Show as sum work package. Sitedrive remembers your choice for this view.
Double-click a line to open the work package in the side panel.
Draw a new work package
- Click the pencil icon (Draw line) in the toolbar.
- Drag from the start area and time to the end area and time.
- Give the new work package a name.
As a shortcut, Alt/Option+drag on the canvas without clicking the pencil. Press Esc to cancel while drawing.
Select and delete
- Click a line to select it. Ctrl/Cmd+click to select several.
- Press Delete or Backspace, or right-click and choose Delete selected.
Show actual progress
The actual progress line shows how work really moved compared with the plan.
- Click the eye icon (Select schedule visualization options).
- Tick Actual progress.
For each area with reported progress, a dashed line runs from the first progress report to the latest one, ending at the area’s current progress. Areas with no progress reports get no dashed line. The line reflects the current state: if work is added to a half-finished area, its end point drops.
Good to know
- The view has no phase colouring and no dependency arrows. Use Takt or Gantt for those.
- The eye menu also offers Deadlines, Names as abbreviations, Resource histogram, Hide empty space rows, Hide completed packages, Holidays, Timeline notes, Takt slots and Row heights. See Colouring and display options.